


Data Mapping, Data Lake,
Data Warehouse and Dashboards in Power BI
Power BI Consulting, from Data Structuring to Dashboard Creation
Control your business indicators, optimize the strategic decision-making process. Learn about the CSP methodology for creating a Data Driven culture.
Consulting in Power BI, from Data Structuring to
the creation of Dashboards
Control your business indicators, optimize the strategic decision-making process.
Learn about the CSP methodology for creating a Data Driven culture.
Companies need a reliable and secure data structure to qualify decision making.
See how we transform the reality of our customers:
Companies need a reliable and secure data structure to qualify decision making.
See how we transform the reality of our customers:
ASSESSMENT AND DATA SANITATION
1. The databases
are they organized?
The Sanitation and Assesment part of the data consists of tidying the house, having a view of how the data is organized and managing to optimize the relationship of the company's systems.
In Assesment, we scan the databases, to relate them, map the information and consolidate any duplicate data, error or inconsistency in the bases.
Doubts? Contact us →

DATA LAYER
2. There is an intermediate layer of data,
Data Warehouse or Data Lake?
Your company may already have organized databases, but still, it is not recommended to read the data directly from the database for reasons of governance, security and performance.
Pulling data from a centralized source simplifies understanding and makes dashboarding easier to develop. A fundamental best practice for the continuous delivery of value in BI.
Doubts? Contact us →
AMAZING PANELS WITH AREA INDICATORS
3. We create amazing dashboards in Power BI.
With the indicators you need.
CSP can assist you in the previous steps or go straight to the creation of the first indicators.
The customer is the boss! We can create dashboards from an Excel spreadsheet. Count on CSP for the simplest and most complex scenarios!
Doubts? Contact us →
OUR PROJECTS
Success Cases
OUR PROJECTS
Success Cases
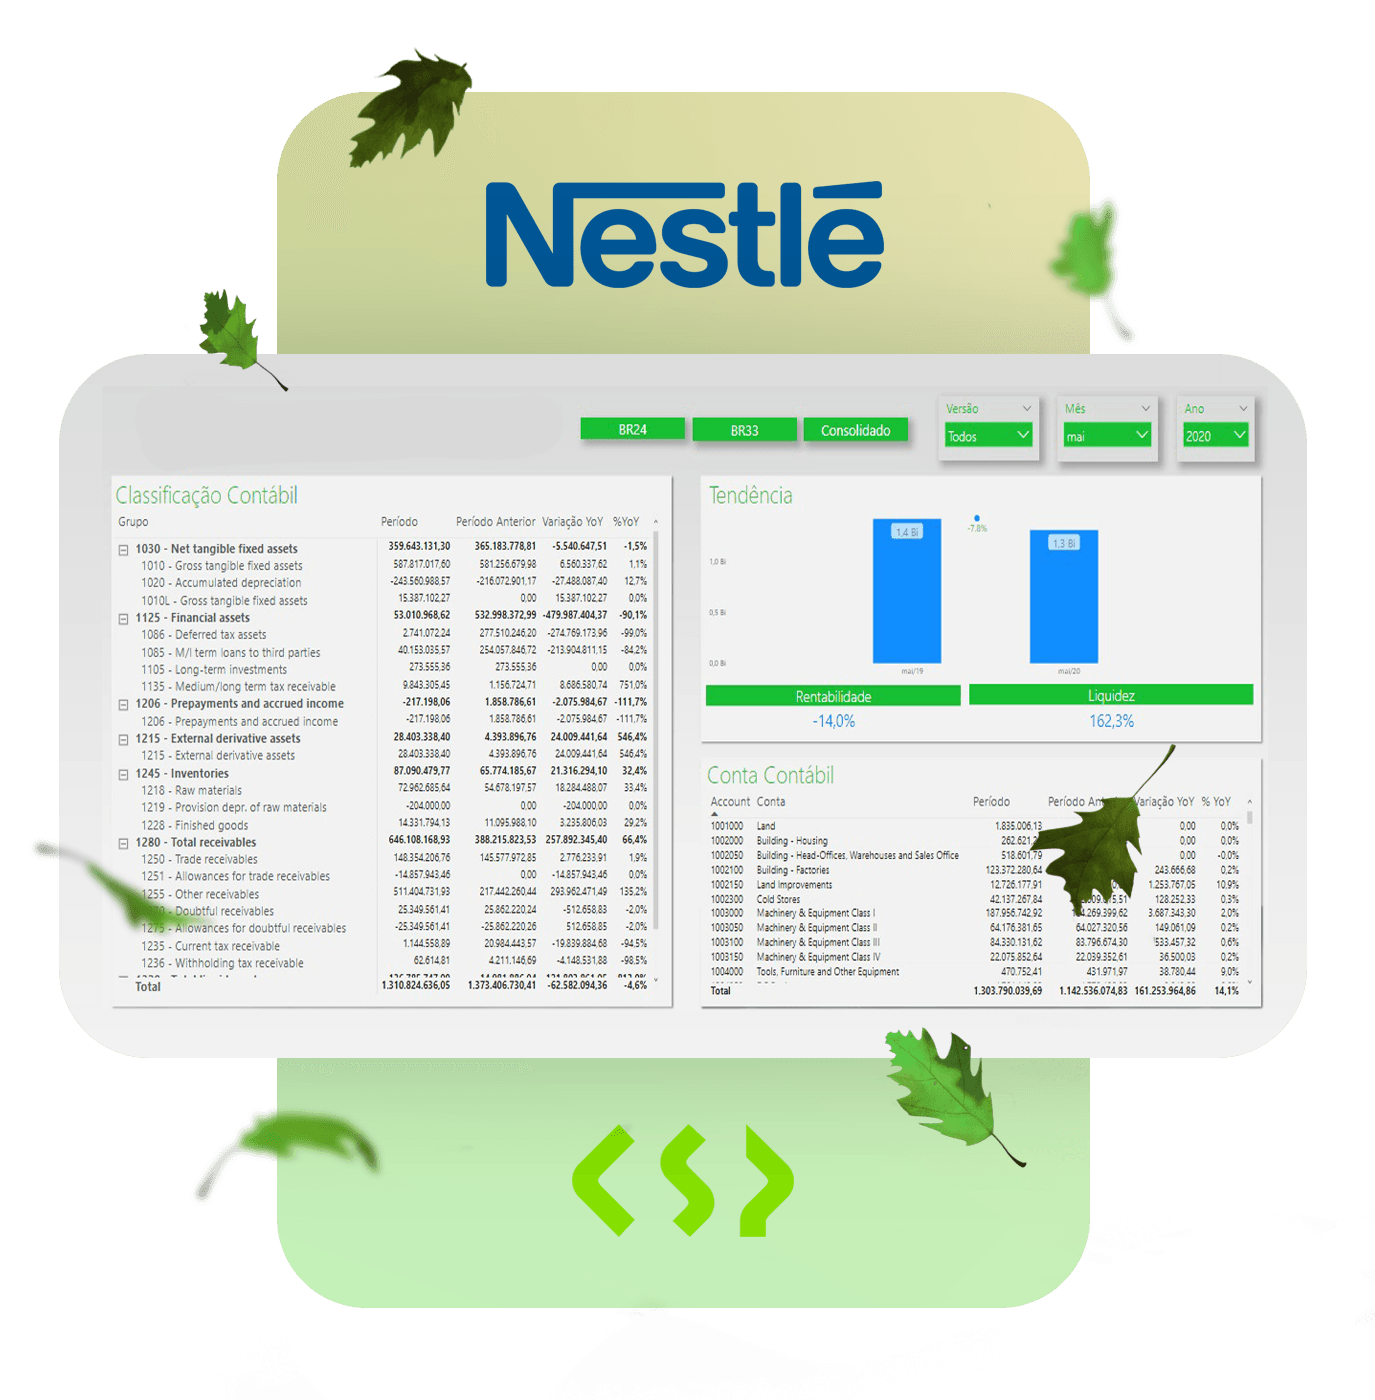
ACCOUNTING AND MANAGERIAL DRE
Nestlé
Nestlé came to us with the need to create a more complete dashboard of accounting DRE in Power BI for the financial controllership area.
We performed the Assesment to clean and map the data and started to build some views, one illustrated below. After a month of the project, the result was detailed DRE panels in a format that helps Nestlé to see the result of the operation in an assertive way.

INVESTMENT PANEL
worth
Many operational steps ceased to exist with the implementation of Valia's investment panel. The data source is a complex spreadsheet in terms of data volume and number of business rules.
CSP optimized the steps and the time gain was enormous. It was found that, after the implementation of the investment panel, the process of generating the information presented to the participants' committee had its time reduced by at least five working days.
ACCOUNTING AND MANAGERIAL DRE
Nestlé
Nestlé came to us with the need to create a more complete dashboard of accounting DRE in Power BI for the financial controllership area.
We performed the Assesment to clean and map the data and started to build some views, one illustrated below. After a month of the project, the result was detailed DRE panels in a format that helps Nestlé to see the result of the operation in an assertive way.
INVESTMENT PANEL
worth
Many operational steps ceased to exist with the implementation of Valia's investment panel. The data source is a complex spreadsheet in terms of data volume and number of business rules.
CSP optimized the steps and the time gain was enormous. It was found that, after the implementation of the investment panel, the process of generating the information presented to the participants' committee had its time reduced by at least five working days.
What are the differentials of CSP Tecnologia?
Our delivery goes far beyond "just" creating Power BI dashboards.
What are the differentials of CSP Tecnologia?
Our delivery goes far beyond "just" creating Power BI dashboards.
We structure your data in an organized, secure and scalable way
Our delivery is complete. We can start with mapping and sanitizing the data, then creating the Data Warehouse and Data Lake, to creating incredible dashboards with the indicators you need.
We make complex integrations with various data sources
Our team develops integrations with several different data sources, we have a lot of experience to ensure that nothing unusual happens in the process
Our team has Microsoft certified professionals
We are Gold Microsoft partners and we have highly trained professionals to meet your company's demand
We have experience with large companies from different segments.
We have large companies in our Power BI customer portfolio that have a long-term relationship of continuous improvement with us.
We structure your data in an organized, secure and scalable way
Our delivery is complete. We can start with mapping and sanitizing the data, then creating the Data Warehouse and Data Lake, to creating incredible dashboards with the indicators you need.
We make complex integrations with various data sources
Our team develops integrations with several different data sources, we have a lot of experience to ensure that nothing unusual happens in the process
Our team has Microsoft certified professionals
We are Gold Microsoft partners and we have highly trained professionals to meet your company's demand
We have experience with large companies from different segments
We have large companies in our Power BI customer portfolio that have a long-term relationship of continuous improvement with us.
We have been Microsoft Gold Partners for over 10 years.
We have been Microsoft Gold Partners for over 10 years.
Igor Martins,
CSP BI head explains no
Do you want control over easy-to-view data and indicators?
Contact our commercial team, schedule a meeting and find out how to get there.
Do you want control over easy-to-view data and indicators?
Contact our commercial team, schedule a meeting and find out how to get there.
Supporting your ongoing journey to digital excellence.

CSP Tech | Copyright 2024 | Information Security Policy | Privacy and Data Processing Policy